|
This lecture was given at the WhiteChapel
Art Gallery Lecture Theatre (London) on 5th April 1987. ( The text was published in the
Constructivist Forum, Issue No.6 -London-1987).
|
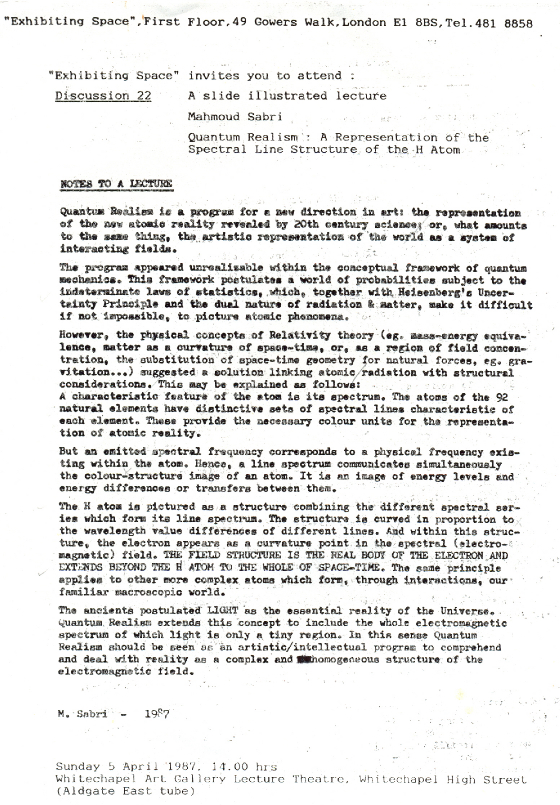
| Representation of the spectral line structure of the H Atom - 1987 |
|
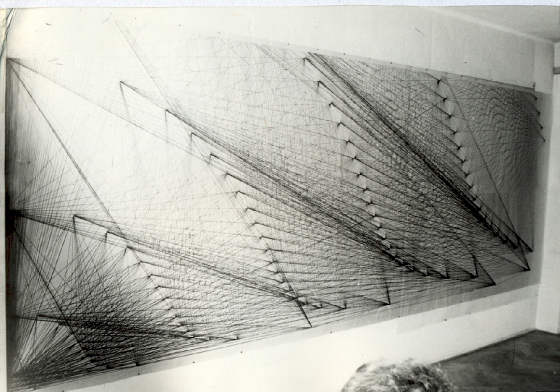
| M.Sabri in front of a representation of the spectral lines of the H Atom - 1987 |
A REPRESENTATION OF THE
SPECTRAL LINE STRUCTURE. OF THE H ATOM
M.Sabri
____________________________________________________________________
In 1971 I defined QUANTUM REALISM (Exhibition
Program, Prague,
26/10/71 – 14/11/71) as a 'graphic experiment synthesizing 2 basic concepts of our age:
(1) The world as PROCESSES rather than READY-MADE
THINGS (Engels).
(2) MASS-ENERGY EQUIVAIENCE: E = M C2
(Einstein).
The synthesis suggested a picture of the world
as a SYSTEM OF ENERGY- PROCESSES. Such a picture however could only be plastically renderedif the correct units are employed.
These have to be derived from nature's ELEMENTARY ie. ATOMIC PROCESSES.
1
I "started with the CHEMICAL PROCESSES through
which macroscopic phenomena are formed by the interactions/combinations of different atoms. A characteristic feature
of an atom is its EMISSION LINE SPECTRUM, ie. the series of coloured lines emitted by aD atom in a state of excitation. The
atoms of each of the 92 natural elements have well-defined sets of such spectral lines. These constitute the visible quantities
by which the otherwise invisible atoms are recognized. Atomic matter therefore finds its distinctive graphic expression
in the pure colour of its spectral radiation.
The QUANTA OF ATOMIC LINE SPECTRA became the
units from which a picture of the world as a SYSTEM OF ENERGY PROCESSES could be constructed.
Within this framework it was possible to make
coloured compositions representing substances according to their chemical formulae, e.g. water, salt, clay, air, nylon, alcohol,
(and even a human figure in proportion to its constituent e1ements)..etc. The basic concern was the specral equivalent of
the formula. Each spectral line was seen as a plastic unit having an intrinsic quantum value. of colour & structure. It
represents a measurable colour area corresponding to a specific wavelength. And it also has a structure expressing the perpendicular
relation between the electric & magnetic fields and the direction of propagation.
2
In the eighties the central interest in my
work gradually shifted towards a definition of inner atomic structure in terms of atomic line spectra. A frequency emitted
by an atom corresponds to a physical frequency existing within the body of that atom. Such a frequency therefore should retain,
in addition to its own intrinsic quantum structure, the inner structure of the emitting atom. Hence the sets of line spectra
emitted by atoms give us simultaneously the colour and structural image of such atoms.
Every composite system, e.g. the H
atom, is associated with a characteristic set of ENERGY LEVELS OR STATIONARY STATES, and these manifest themselves directly
in SPECTRA. Each such ENERGYLEVEL OR STATIONARY state is characterized by a definitive value of ENERGY, the lowest being called
the GROUND STATE.
An atom emitting a quantum of electromagnetic
radiation is described as jumping from an upper to a lower energy level. The energy value of such a quantum equals the energy
difference between the 2 levels according to equation: hT = Eu – El
(where h is Planck Constant, T is frequency).
An atom absorbing a quantum of electromagnetic
radiation is described as making the inverse jump from a lower to an upper level or state. The energy value of the absorbed
quantum likewise equals the energy difference between the 2 levels or states. The statement that the
'atom jumps from one level or state to another'
should be seen as a METAPHOR rather than
literally taken. This is equally the case if
the process is described as a 'transition' or a 'transfer' of energy between 2 levels or states. The process may also be described
in terms of another metaphor. Energy level differences corresponding to frequencies of atomic line spectra may be described
as frequencies at which atomic structure RESONATES. The atom may be seen as a system having a specific set of RESONANT FREQUENCIES.
An incident light wave disturbs the system and causes the atom to react by radiating a wave of the same frequency as the incident
wave.
These different models describing an emission-absorption
process are EQUIVALENT, and should lead to equivalent artistic structures. They have a common physical skeleton expressed
by the 2 basic postulates: (a) The atom is a system of ENERGY LEVELS or STATIONARY states. (b) The electromagnetic LINE SPECTRUM
emitted by an atom corresponds to ENERGY DIFFERENCES between ENERGY LEVELS OR
STATES.
I applied this program to the simplest spectral
set i.e. that of the Hydrogen atom (H), which represents, with its single electron, the simplest atomic structure.
3
The ENERGY LEVELS of the HYDROGEN ATOM are usually represented in a DIAGRAM form after the work of Walter Grotrian.
The DIAGRAM is composed of groups of PARALLEL VERTICAL LINES representing spectral lines intersecting a group of PARALLEL
HORIZONTAL LINES representing energy levels. The DIAGRAM gives information about allowed energy values of different levels,
relative distances between them, ionization potential, relative excitation energies,...etc. as well as the distribution of
the H line spectrum into definitive spectral groups
or series. The lines of each such SERIES terminate on a specific COMMON
HORIZONTAL LINE (energy level). The length of each VERTICAL (i.e. spectral) LINE connecting 2 energy levels is directly PROPORTIONAL
to the FREQUENCY of the spectral line.
The DIAGRAM shows 6 spectral series:
( 1) The LYMAN series: The wavelengths of its
lines fall in the ultraviolet region of the spectrum. All vertical lines representing this series terminate on the lowest
level, ie. ENERGY LEVEL No.1.
(2) The BAIMER series: The wavelengths of its
lines fall in the visible region. All lines representing this series terminate on ENERGY LEVEL No.2.
(3) The PASCHEN series occurs in the infra-red region. All lines of
this series terminate on ENERGY LEVEL NO.3.
(4) The BRACKETT series falls in the infra-red region. All its lines
terminate on ENERGY LEVEL No.4.
(5) The PFUND series falls in the infra-red region. All its lines
terminate on ENERGY LEVEL No.5.
(6) Lastly the HUMPHREY series whose lines terminate on ENERGY LEVEL
No.6.
4
I reconstructed the foregoing spectral data according to a hypothesis
allowing for a change of the diagram into a naturalistic image combining the colour and structural values of the H atom
as a unity. The hypothesis briefly is: (1) That the single electron of the H atom is an energy concentration point of the
electromagnetic field. (2) That this (electron)mass point is a curvature point of space-time.
The reconstruction proceeded as follows:
(1) In Grotrian's DIAGRAM the lengths
of the VERTICAL (ie. spectral) lines connecting the HORIZONTAL (i.e. energy levels) lines are directly PROPORTIONAL to FREQUENCIES
of spectral lines. I introduced a 2-FOLD CHANGE here: (a) I calculated the IENGTHS of the VERTICAL (spectral) lines in direct
PROPORTION to WAVELENGTH rather than FREQUENCY.
A WAVELENGTH value is a measure of SPATIAL
DISTANCE whereas FREQUENCY is a pointer of ENERGY SIZE. As the aim is to ,construct
a pictorial model representing the FORM/STRUCTURE of the R atom, WAVELENGTH rather than FREQUENCY values are relevant. (b)
In addition to the WAVELENGTH value I introduced a SECOND SPATIAIL value separating the HORIZONTAL (energy levels) lines.
HORIZONTAL (energy level) lines may equally be, considered as a system of concentric SHELLS whose common centre is the nucleus.
Therefore their RADII values become the basis for additional DISTANCE valueso These are given by equation:
r = n2 ao (n= 1,2,3,…etc.)
(where n is the energy-level or shell
QUANTUM NUMBER, ao is Bohr radius, ie. the radius value for the first orbit of the H atom & equals 0.529 A).
Hence we have 2 DISTANCE VALUES between the
HORIZONTAL (energy levels) lines representing: 1) The DISTANCE as .a RADIUS value, i.e. as a separation value between
electronic shells. (2) The DISTANCE as spectral wave-length value, i.e. as an electromagnetic quantum INTERVAL between 2 energy
levels.
(2) I made use of the THEORETICAL
POSSIBILITY which allows for an 'INFINITE' number of spectral-line series in addition to the observe~ detected spectral series.
It is clear that whereas these may satisfy the requirements of a graphic diagram (such as Grotrian's) they cannot be sufficient
to Build a satisfactory picture of the H atom. For this purpose it was necessary to make use of both the detected & the
theoretically possible spectral series. These are defined according to equation:
V = RH (1/n12 - 1/n22 )
where v is the wave number, RH is
the Rydberg Constant for Hydrogen.
For the calculation of wave numbers of theoretically
possible spectral lines and series of the H atom, we substitute the following values:
|
Lyman |
Balmer |
Paschen |
Brackett |
Pfund |
Humphrey |
|
N1 = 1 |
N1 = 2 |
N1 = 3 |
N1 = 4 |
N1 = 5 |
N1 = 6 |
|
N2
>= 2 |
N2
>= 3 |
N2
>= 4 |
N2
>= 5 |
N2
>= 6 |
N2
>= 7 |
(3) The whole structure of Grotrian's
DIAGRAM is one of PARALLEL lines (VERTICAL & HORIZONTAL). However, Euclid's 5th postulate of parallel lines has already been
replaced by different axioms in non-Euclidean geometry. According to Riemann's amended 5th postulate 'for any line L and any
point P not on L, there are no lines through P parallel to L'. Lines even seemingly parallel are bound to meet at a point.
Hence a pictorial representation of a physical system such as the H atom must take this new geometrical axiom into account.
A similar consideration applies on a physical level. According to Einstein's MASS-ENERGY EQUIVALENCE an elementary particle,
e.g. an electron, may be postulated as a point of great concentration of energy or of field strength. Such a particle may
equally be visualized as a curvature point of space-time, i.e. a cause & effect of space-time geometry curvature. This
conforms to Einstein's other EQUIVALENCE principle, ie. that of PHYSICS & GEOMETRY. Both physical and geometrical considerations
therefore point to a
solution favouring a principle of CONVERGENCE.
I altered Grotrian's DIAGRAM allowing
for all PARALLEL lines (VERTICAL & HORIZONTAL) to converge. The VERTICAL lines of each SPECTRAL SERIES were made to converge
at their specific TERMINAL (energy levels) lines thus
producing convergence points on the successive
(HORIZONTAL) levels. Each such point is an energy concentration point representing a POTENTIAL electron. The HORIZONTAL (energy
levels) lines were equally made to converge in proportion to the gradually decreasing wavelength values of spectral lines.
All such HORIZONTAL lines finally converged forming with the converging lines of the LYMAN spectral series, an ELECTRON PARTICLE
POINT on energy level No.1 (GROUND STATE).
( 4) Finally there is the question
of the FINE STRUCTURE of the H spectral lines. Each energy level consists of a number of SUB-LEVELS lying very close to one
another. Their number is directly proportional to the energy level quantum number. Energy differences between such SUB-LEVELS
equally correspond to spectral line emissions. Consequently each H spectral line should consist of a number of components
which are detectable when examined under high resolutiono The number of such fine structure lines for different spectral series
is as follows:
|
|
Lyman series |
Balmer series |
Paschen series |
Brackett series |
Pfund series |
Humphrey series |
|
Number of Components for each
spectral line |
1 |
3 |
5 |
7 |
9 |
11 |
The significance of these numbers is that they
correspond to the number of SPACE ORIENTATIONS associated with the different states of motion of the electron inside the H
atom. The configuration of spectral lines therefore can assume structural values corresponding to the electron states and
space orientations in the various energy levels and sublevels of the H atom. This is shown in the following table:
|
SPECTRAL SERIES |
Lyman |
Balmer |
Paschen |
Brackett |
Pfund |
Humphrey |
|
ELECTRON STATES DESIGNATION |
s |
p |
d |
f |
g |
h |
|
SPACE ORIENTATION |
SHELL No.1 |
1 |
- |
- |
- |
- |
- |
|
SHELL No.2 |
1 |
3 |
- |
- |
- |
- |
|
SHELL No.3 |
1 |
3 |
5 |
- |
- |
- |
|
SHELL No.4 |
1 |
3 |
5 |
7 |
- |
- |
|
SHELL No.5 |
1 |
3 |
5 |
7 |
9 |
|
|
SHELL No.6 |
1 |
3 |
5 |
7 |
9 |
11 |
|
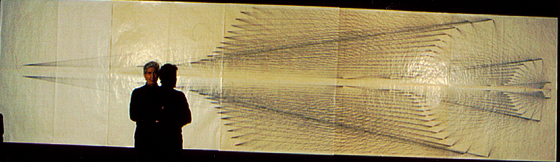
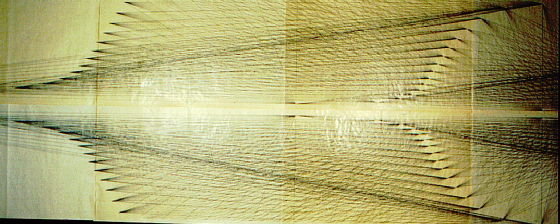
| Representation of the spectral lines of the H Atom - 1987 |
CONCLUSION:
The solution was possible by linking OBSERVABLE quantities (i.e. line
spectra) with EXPERIMENTAL data (e.g. H atom structure, electron shells & states of motion,...) and THEORETICAL concepts
(e.g. relativity, quantum physics ,..etc.). This made it possible to define distances & intervals and construct a 2-d.
space-time metric.
The body of the H atom appears in the drawings as a complex vector
space. Every theoretically possible energy transition or state of motion of the electron is described in this space by a vector
representing a measurable wave-length quantity. This gives us a quantized space-time whose constituent units are measurable
electromagnetic quanta. It means an EQUIVALENCE of space-time AND electromagnetic units. But the electromagnetic field
requires no supporting medium. The curved space-time IS the electromagnetic field structure. And the field curvature
is manifested in the different but harmoniously related wave-lengths associated with its component quanta. The dualism therefore
resolves itself by reducing space-time to measurable values of the electromagnetic field. The 'field is the only reality'.
A field quantum is characterized by a set of
mathematically related values. These include VARIABLES, e.g. energy, momentum, wave-length,..., and CONSTANTS, i.e. VELOCITY
c & ACTION h. However, like any other entity, a quantum has its own PROPER TIME value which may be defined as the RECIPROCAL
of frequency. A. quantum therefore represents a specific 'space-time' INTERVAL, and the structure may be described in this
sense as a system of such intervals.
The drawings, however, essentially reveal a
curved spiral structure of energy levels (or points) and spectral lines. Zach point is a convergence point of a group of such
lines. And within this structure the single electron of the H atom appears as a concentration point of the quanta of the electromagnetic
(i.e. spectral) field. The electron-point is indivisible because it is the product of field curvature geometry. The field
structure is the real body of the electron and extends beyond the H atom to the whole universe.
The ancients postulated LIGHT as the essential
reality of the universe. Quantum Realism extends this concept to include the whole electromagnetic spectrum of which light
is only a tiny region. It also identifies this spectrum with the newly discovered sub-atomic reality. The electromagnetic
field is the stuff, the structure & container and the absolute messenger
of this universe.
|